
 CSO
Planetary Disk Survey with the SHARCII.
CSO
Planetary Disk Survey with the SHARCII. 
Astronomers
studied nearby planetary disk systems using the SHARCII camera.
Fomalhaut is a nearby (distance = 7.7pc away from the Sun) main
sequence (A3V) star, and the age is estimated to be about 200 million
years. Following the SCUBA 450- and 850- micron observations reported
by Holland et al 2003 (shown right), the SHARCII made a sensitive
observations on the debris disk system at 350 micron. The SHARCII
image, shown left, shows a complete ring, inclined slightly elliptical
dust disk of radius ~ 150 AU, offset from the star by about 10
AU. The SHARCII image was deconvolved with HiRes, as implemented
by the JPL/Spitzer group, to obtain higher resolution image from the
raw data, assuming a Gaussian beam pattern of the telescope. The
SHARCII result was published by Marsh
et al 2005 in Astrophysical Journal.
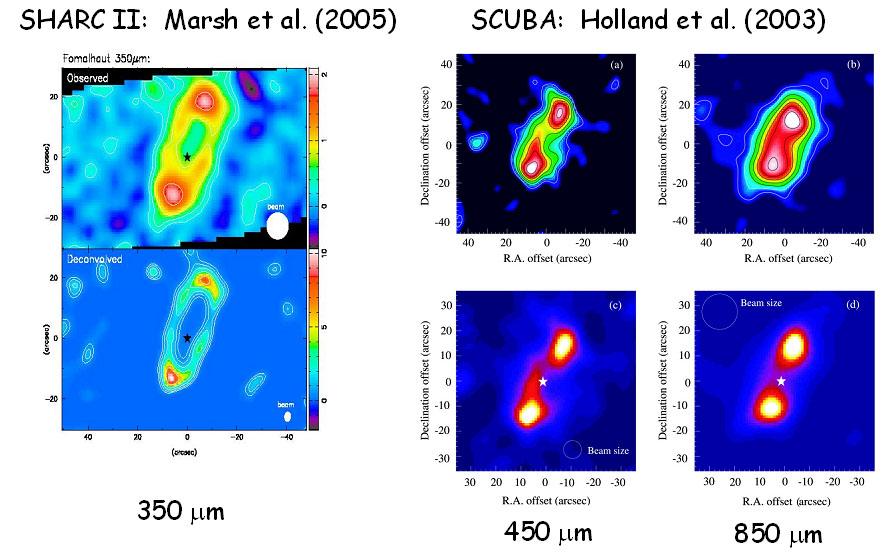
Figure 1.
Comparison of SHARCII 350 micron image with 450- and 850 micron images
taken with SCUBA at JCMT.
VEGA captured by SHARCII
Astronomers study the detail structure of the nearby debris disk system
surrounding
Vega, an main sequence (A0V) star, located 7.76 pc away from the
Sun.
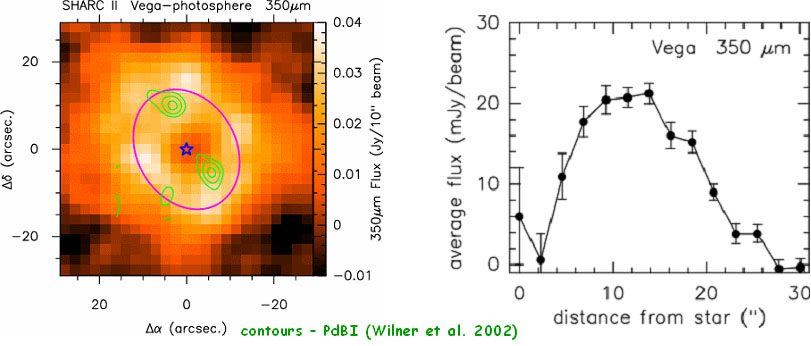
Figure 2. Left
image is an overlay of 1.3 mm continuum emission after subtraction of
the central star component (green contour, Wilner et al. 2002) on the
350 micron SHARCII image. Right diagram shows the radial
distribution of dust from the central star.
SHARCII resolved nearby debris disks systems
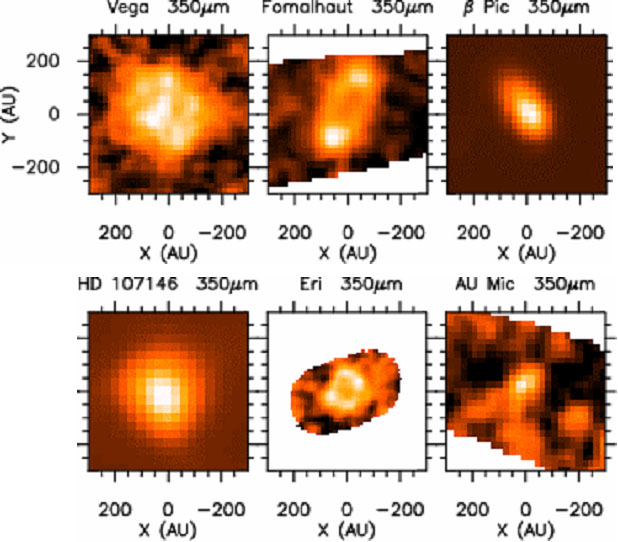
Figure 3. SHARCII neaby debris disks images taken at 350 micron.
Results of more distant debris disks
SHARCII measured
the flux of more distant main sequence stars HD 92945 and
AU Mic at 350 micron. Following diagrams show so called spectral
energy distribution (SED) of the stars. Red points are the
measurements done with the SHARCII. The temperature was measured
to be about 40 K in both cases. The mass was estimated to be
about 1/1000 to 1/10000 of the Moon mass. This was reported by
Chen
et al 2005 in Astrophysical Journal.
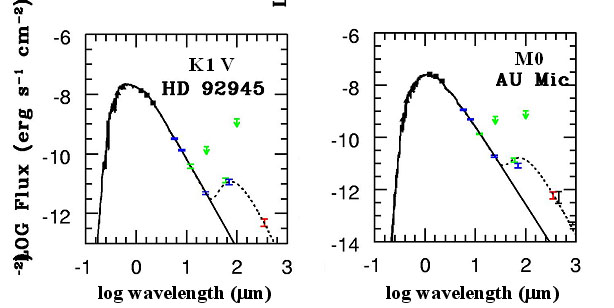
Figure 4. Spectral energy distribution diagrams towards two
debris disks measured with the SHARCII at 350 micron (red bars) and
other infrared wavelength.