
 Bolocam
Galactic Plane Survey (BGPS) Data Archive Released
Bolocam
Galactic Plane Survey (BGPS) Data Archive Released 
The Bolocam
Galactic Plane Survey (BGPS) is a 1.1 mm continuum survey of the
Galactic Plane made using Bolocam on the Caltech Submillimeter
Observatory. Millimeter-wavelength thermal dust emission reveals the
repositories of the densest molecular gas, ranging in scale from cores
to whole clouds. By pinpointing these regions, the connection of this
gas to nascent and ongoing star formation may be explored. The BGPS
coverage totals 170 square degrees (with 33" FWHM effective
resolution). The survey is contiguous over the range -10.5deg < l
< 90.5deg, |b|
< 0.5deg. Towards the Cygnus X spiral arm, the coverage was
flared to |b| <
1.5deg for 75.5deg < l < 87.5deg. In addition, cross-cuts to |b|
< 1.5deg
were made at l = 3, 15, 30 and 31. The total area of this section is
133 square degrees. With the exception of the increase in latitude, no
pre-selection criteria were applied to the coverage in this region. In
addition to the contiguous region, four targeted regions in the outer
Galaxy were observed: IC1396 (9 square degrees, 97.5deg < l <
100.5deg, 2.25deg < l < 5.25deg), a region towards the Perseus
Arm (4 square degrees centered on l = 111deg, b=0deg near NGC7538),
W3/4/5 (18 square degrees, 132.5deg < l < 138.5deg) and Gem OB1
(6 square degrees, 187.5deg < l <
193.5deg). The survey has detected approximately 8,400 sources, to an
rms noise level in the maps ranging from 30 to 60 mJy beam-1. The BGPS
survey and catalog provide an important database for future
sub/millimeter observations with the Herschel Space Observatory, ALMA
and others.
The maps and source catalog are in a public archive managed by NASA's
Infrared Processing and Analysis Center (IPAC), where a survey
description and documentation can be found.
For a detailed description of the BGPS observations and method, please
refer to the
BGPS paper.
The data can be retrieved from the
NASA/IPAC Infrared Science Archive Web Site.
The BGPS project is supported by the National Science Foundation
through NSF grant AST-0708403 to the University of Colorado. J.A.
was supported by a Jansky Fellowship from the National Radio Astronomy
Observatory (NRAO). The first observing runs for BGPS were supported by
travel funds provided by NRAO. Team support was provided in part by NSF
grant AST-0607793 to the Universityof Texas at Austin.
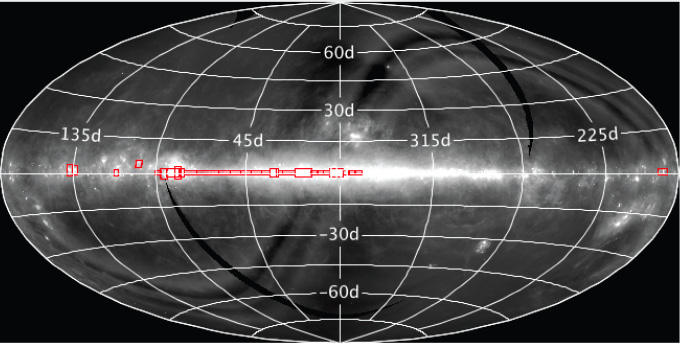
Figure
1. The BOLOCAM GPS mosaics are overlayed in red on the
all-sky ISSA image above.
Image credit: NASA/IPAC Infrared Science Archive.
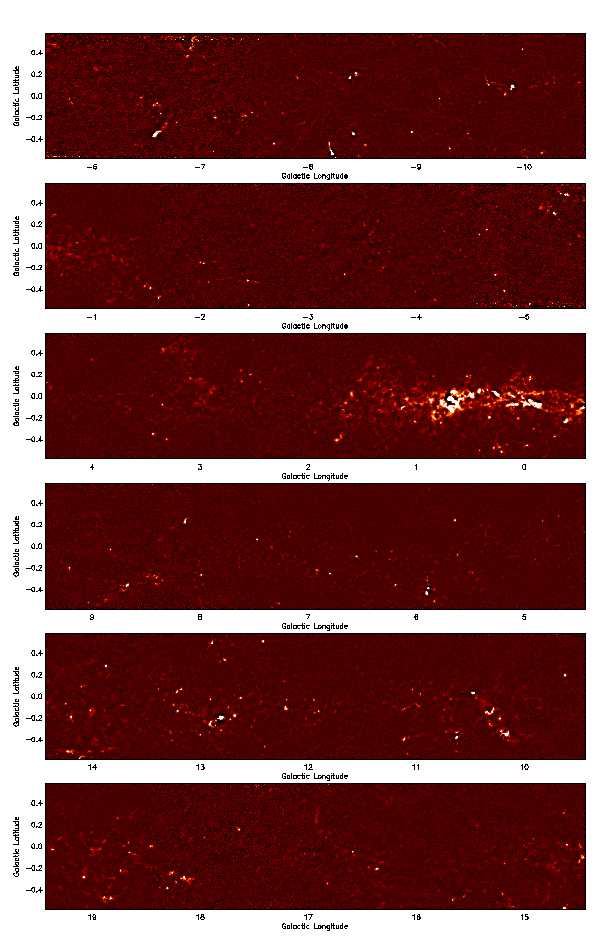
Figure
2. l = 10.5deg to l = 19.5deg Units are Jy
beam1. In this figure and the following, the brightest sources, e.g.
Sgr B2, Sgr A, and sources near l = 10deg and l = 13deg, appear to be
saturated, but this is only a display artifact.
The astrophysical sources are always much fainter than the atmosphere
(which is within the dynamic range of
the detectors) and therefore do not saturate. The noise is more
pronounced from l = 7deg to l = 2deg because this
region was observed less.
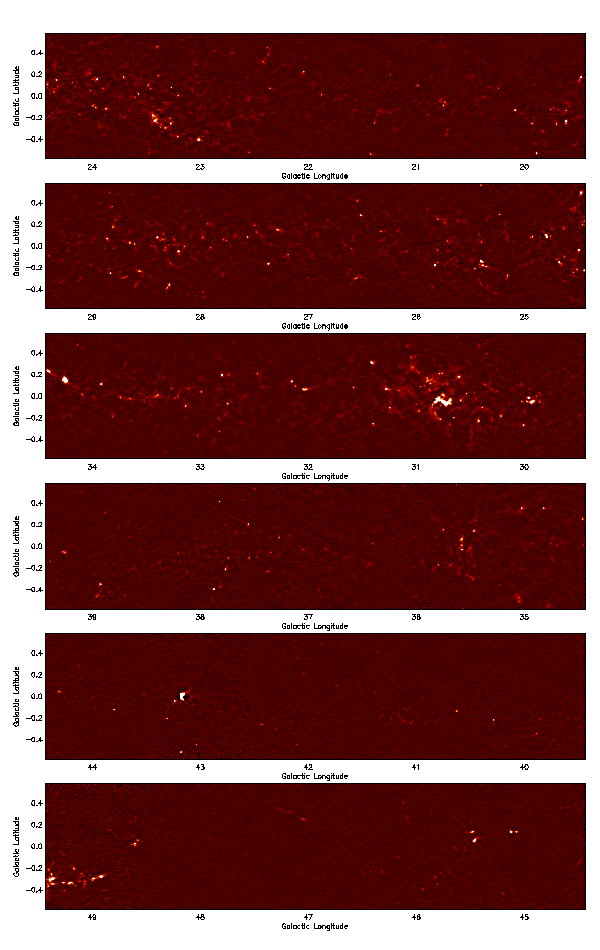
Figure 3. l = 19.5deg to l = 49.5deg. Units are Jy
beam1. G34.3+0.15, W 51, W 43, W 49, and M 17 appear to be
saturated, but this is the only a display artifact. The 20deg < l < 40deg region through
the 4-8 kpc molecular ring and
approximately the termination of the galactic bar is particularly rich
in clumps.
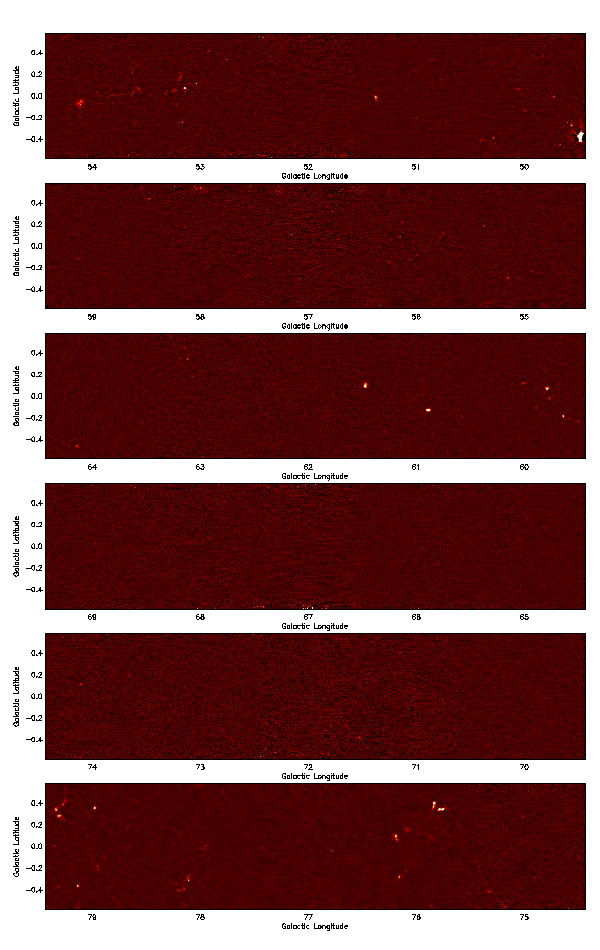
Figure 4. l = 49.5deg to l = 74.5deg. In comparison
to the inner galaxy, the 65deg < l < 75deg region has a
very sparse
population of faint clumps.
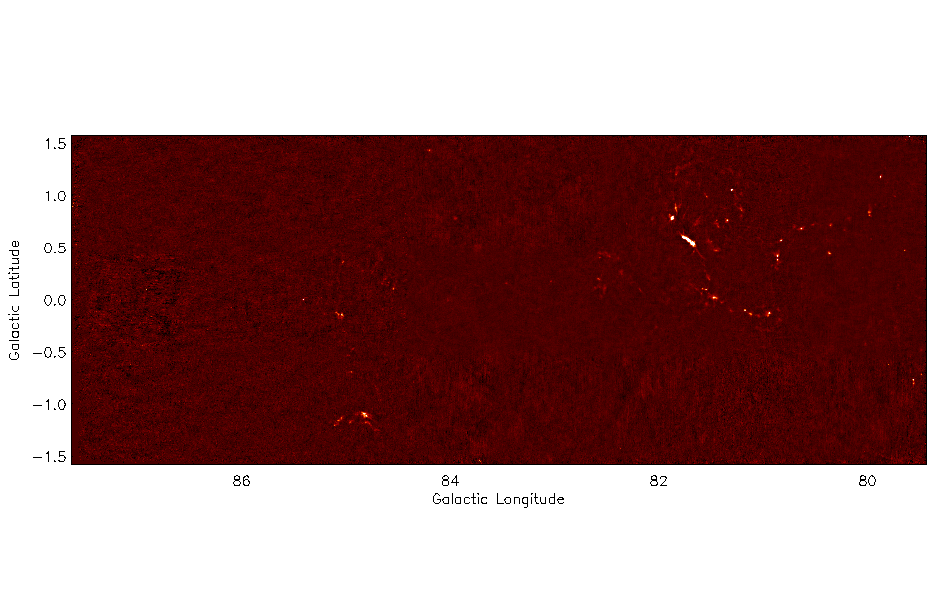
Figure 5. The Cygnus Arm. Note
that coverage in b is extended to ±1.5 deg.
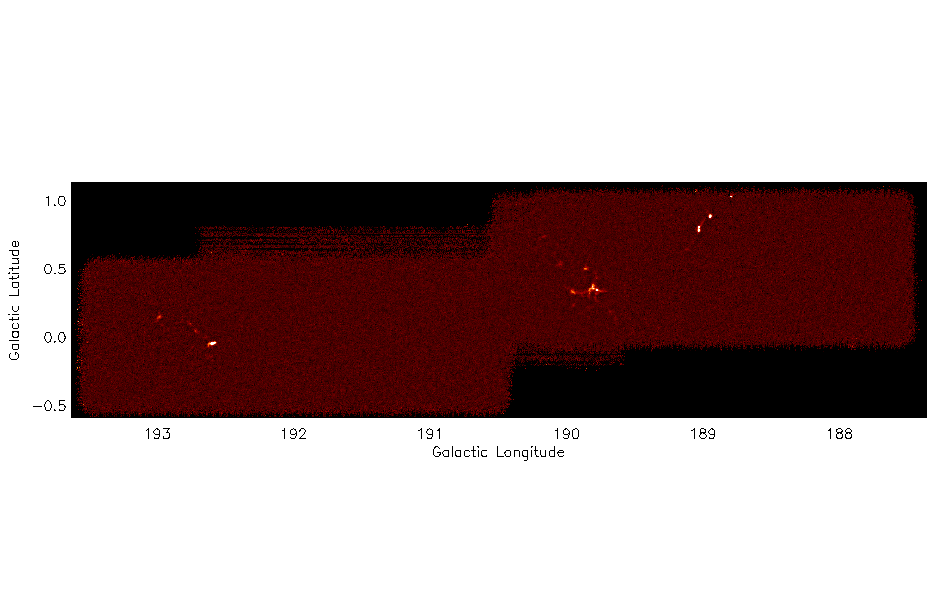
Figure 6. Gem OB1. This region
has been thoroughly surveyed in NH3, and is discussed in Dunham et al.
(2009).
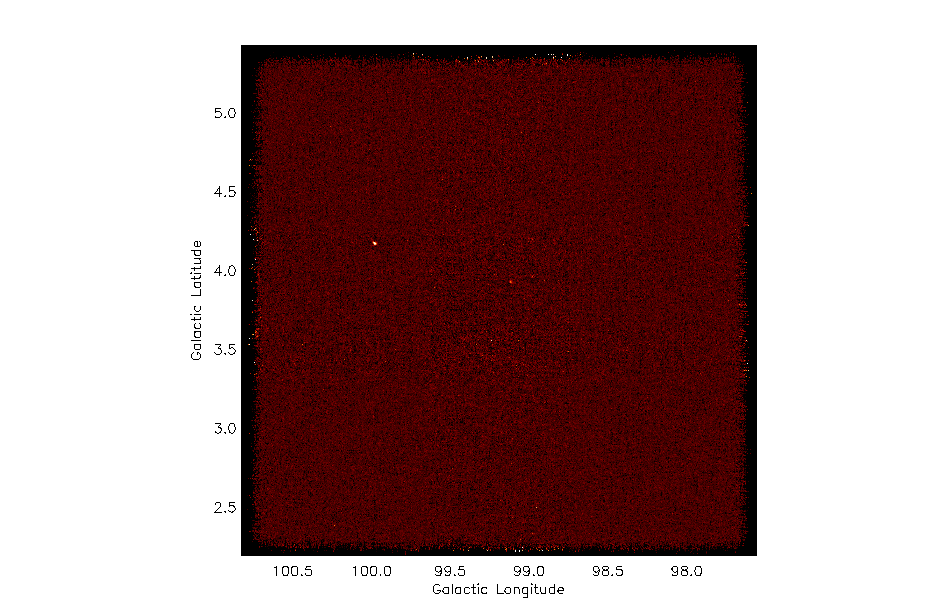
Figure 7. The IC1396 region. In
spite of copious CO emission here, there are only two faint sources
detected in 9 square degrees.
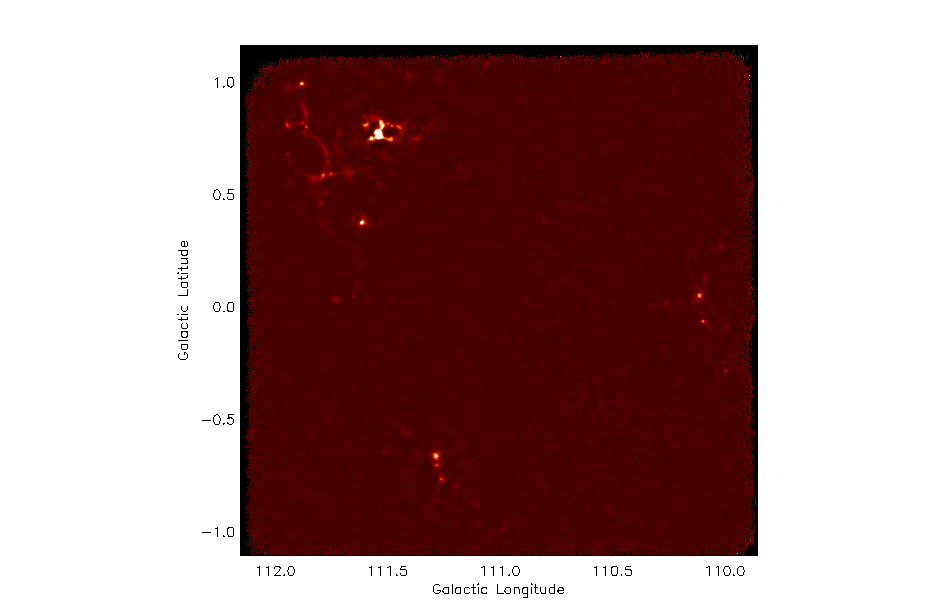
Figure 8. Cloud complexes centered at l = 111deg in the Perseus
Arm. The NGC 7538 complex is in the upper-left.
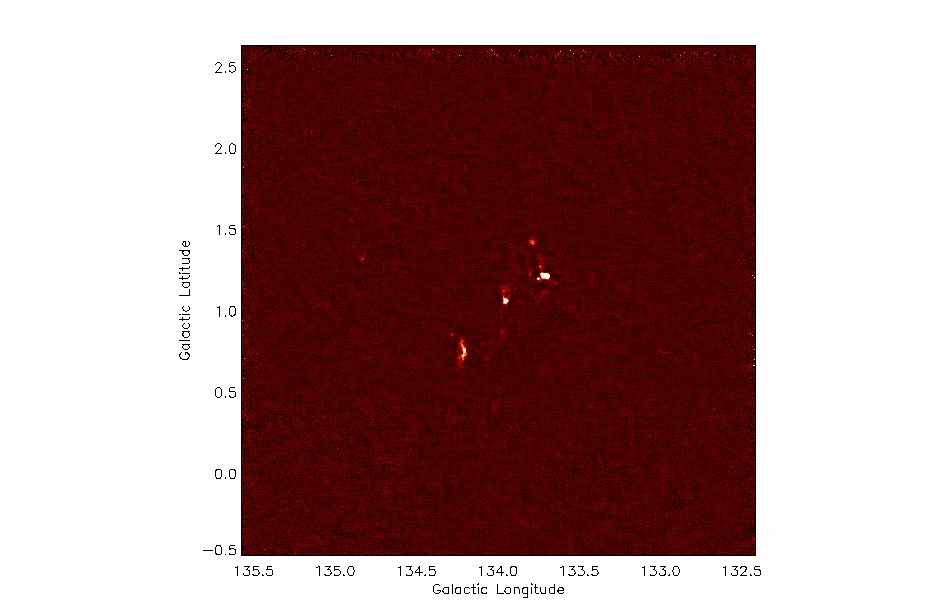
Figure 9. W3. The W3(OH)/W3 Main complex is the bright
source on the right side of the image.
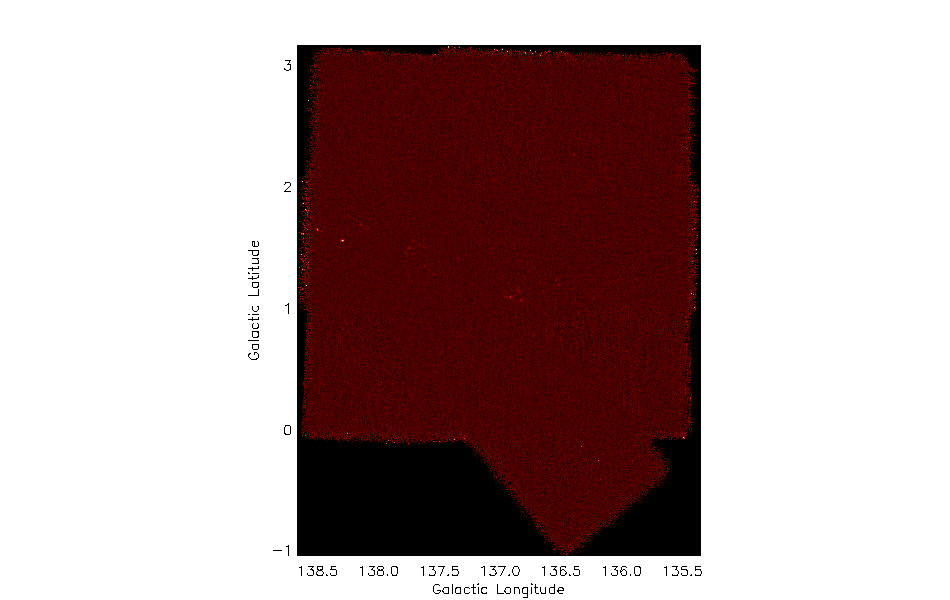
Figure 10. W3. The W3(OH)/W3 Main complex is the bright
source on the right side of the image.
Go back to A Digest of Recent News and
Scientific Results at the Caltech Submillimeter Observatory